# http://www.sthda.com/english/wiki/visualize-correlation-matrix-using-correlogram
# option 1
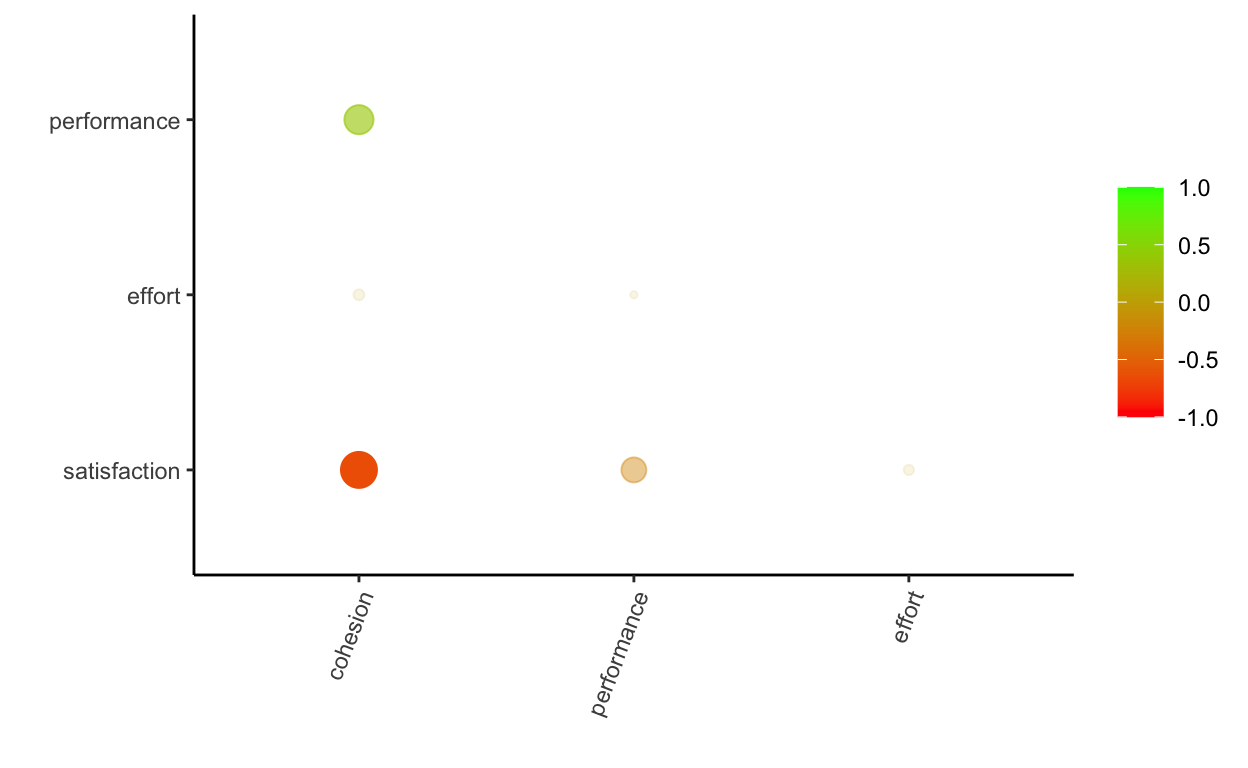
library(corrr)
df %>% dplyr::select(-team) %>% corrr::correlate() %>%
corrr::rearrange(method = "MDS", absolute = F) %>%
corrr::shave() %>%
corrr::rplot(shape = 19, colors = c("red", "green")) +
theme(axis.text.x = element_text(angle = 69, hjust = 1))
# option 2 - x on non-significant effects

library(rstatix)
mydata <- df %>%
  dplyr::select(-team)

cor.mat <- mydata %>% cor_mat()
cor.mat %>%
  cor_reorder() %>%
  pull_lower_triangle() %>%
  cor_plot(label = T)

# option 3 - blank on non significant effects

library(corrplot)
res <- df %>% dplyr::select(-team) %>% cor()
corrplot(res, type = "upper", order = "hclust",
         tl.col = "black", tl.srt = 45)

Bo\(^2\)m =)