intercept <- 1
b <- 0.7
n <- 5
x <- rnorm(n, 5, 2)
y <- intercept + b*x + rnorm(n, 0, 0.3)

df <- data.frame(
  'x' = c(x),
  'y' = c(y),
  'id' = c(1:n)
)

library(tidyverse)

guessintercept <- -1
guessb <- -1

df <- df %>%
  mutate(guessy = guessintercept + guessb*x)

df <- df %>%
  mutate(predictionerrors = abs(y - guessy))

totalerror <- sum(df$predictionerrors)
totalerror
[1] 68.11909# do the same thing but across a range of estimated intercept and slope values
# save the total error each time
df <- data.frame(
'x' = c(x),
'y' = c(y),
'id' = c(1:n)
)
guessintercepts <- seq(from = -1, to = 1, by = 0.1)
guessbs <- seq(from = -1, to = 1, by = 0.1)
calculateerror <- function(guessintercept, guessb){
df <- df %>%
mutate(guessy = guessintercept + guessb*x)
df <- df %>%
mutate(predictionerrors = abs(y - guessy))
totalerror <- sum(df$predictionerrors)
return(totalerror)
}
runs <- length(guessintercepts) * length(guessbs)
count <- 0
storeresults <- matrix(, ncol = 3, nrow = runs)
for(int in guessintercepts){
for(b in guessbs){
count <- count + 1
err <- calculateerror(int, b)
storeresults[count, 1] <- int
storeresults[count, 2] <- b
storeresults[count, 3] <- err
}
}
results <- data.frame(storeresults)
names(results) <- c('interceptestimate', 'bestimate', 'predictionerror')
graphresults <- results %>%
unite(interceptestimate, bestimate,
col = 'estimates',
sep = ', ')
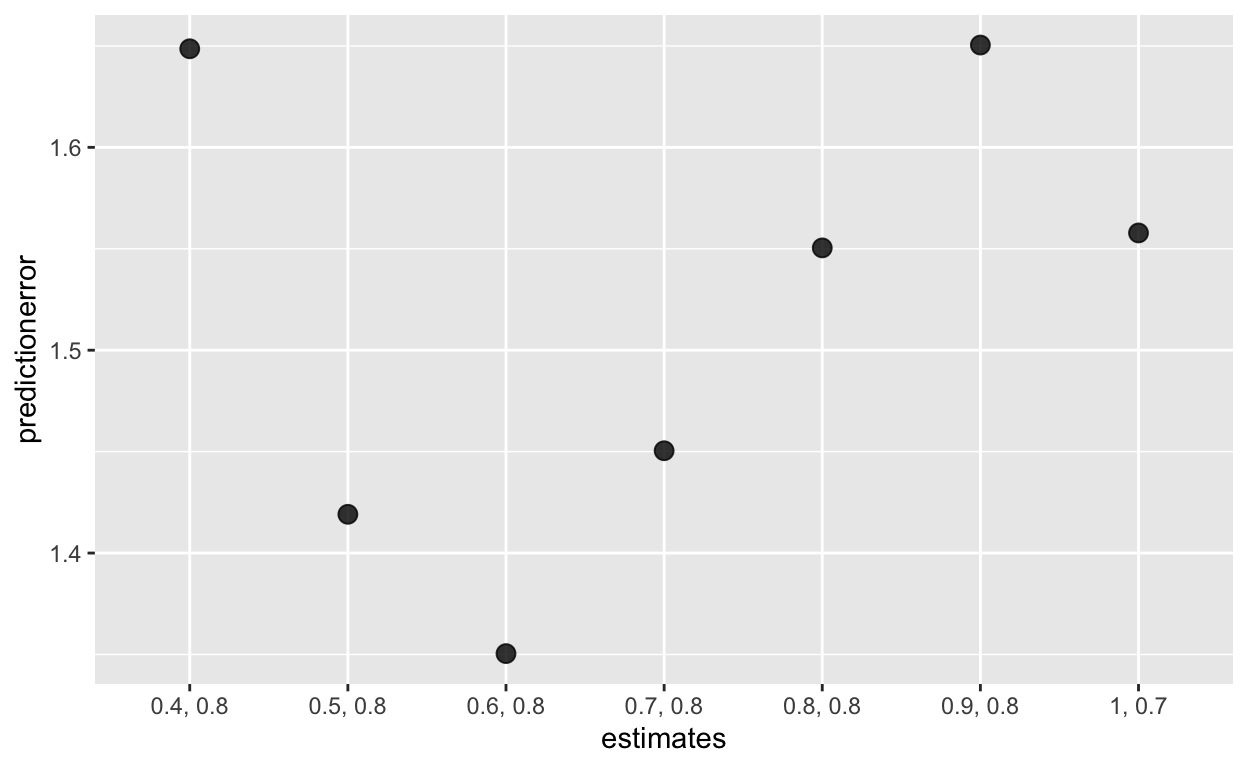
ggplot(graphresults %>% filter(predictionerror < 1.7), aes(x = estimates, y = predictionerror)) +
geom_point(size = 3, alpha = 0.8)
Bo\(^2\)m =)