Some practice simulating network diffusion. Inspired by Cheng-jun’s example.
I’ll start by explaining one iteration through the code before showing the full model. The steps include:
generate a network
seed it with infected individuals
find the nearest neighbors of the infected individual(s)
the neighbors become infected with probability p
add all of the newly infected individuals to a store list
find the nearest neighbors of the infected individual(s)
… continue until the entire network is infected
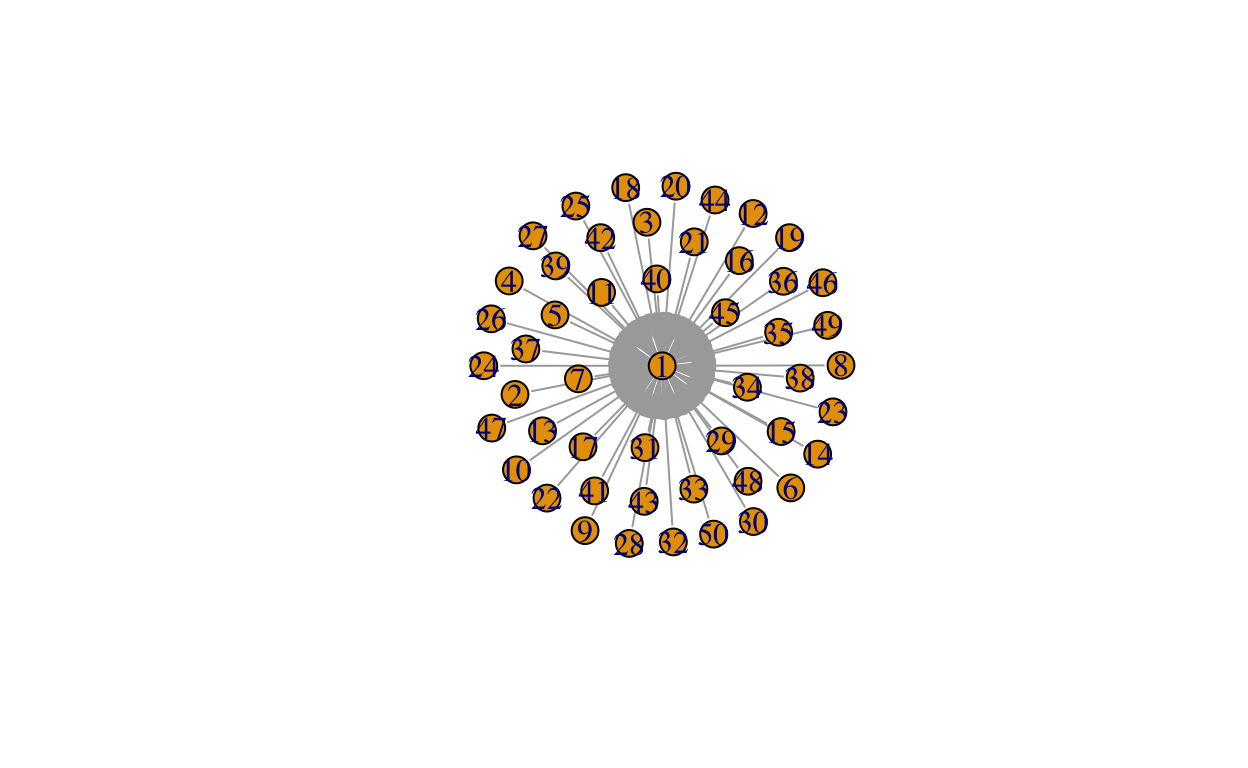
Create network.
library(igraph)
library(animation)
library(tidyverse)
# create network
net_size <- 50
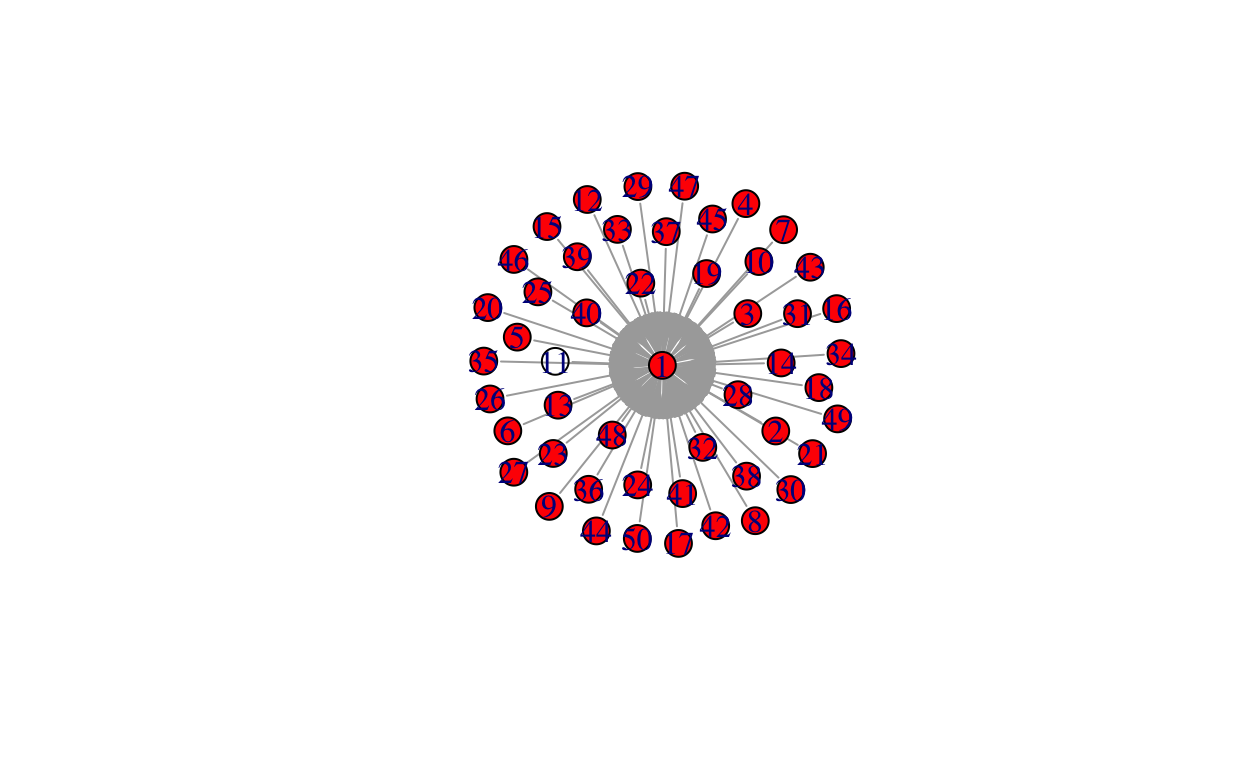
gstar <- graph.star(net_size)
plot(gstar)

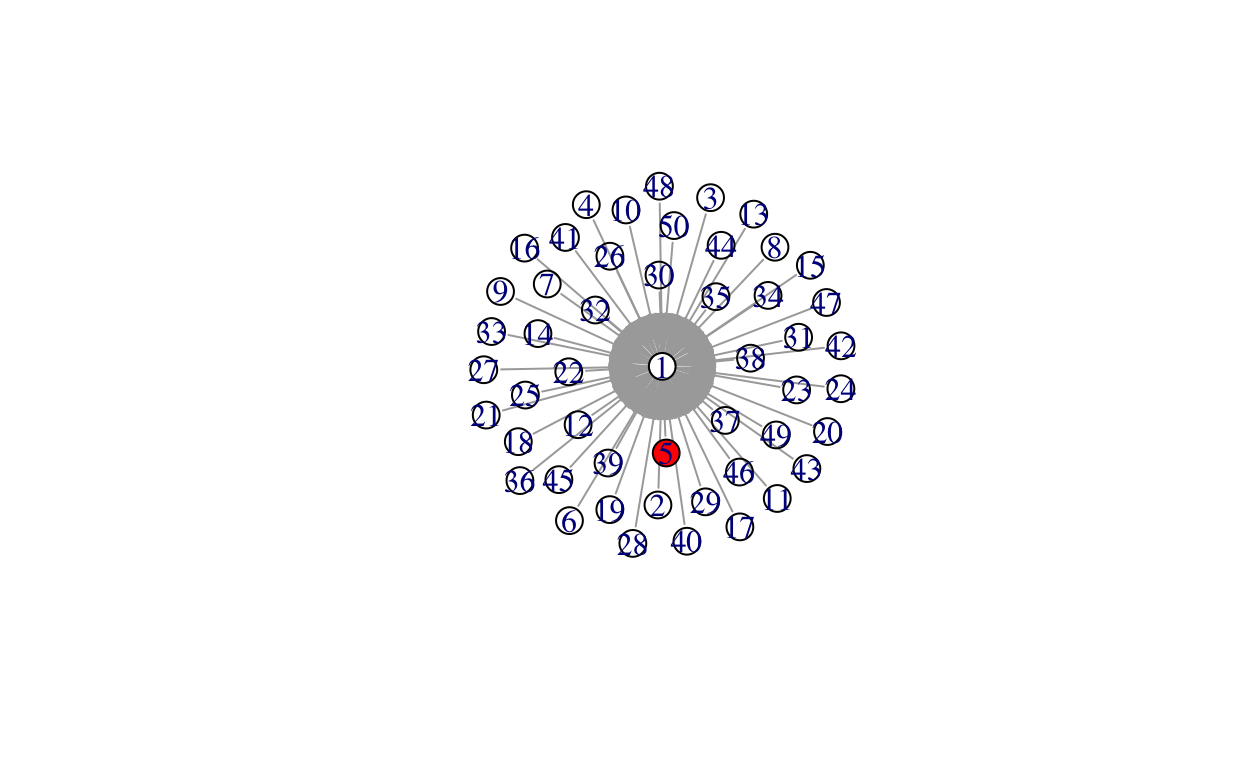
Seed it, meaning place an infected individual into it.
number_initially_infected <- 1
first_infected <- sample(V(gstar), number_initially_infected)
## change this graph object to a pure number
first_infected <- as_ids(first_infected)
first_infected
[1] 24Place the first infected individual into a list.
infected <- list()
infected[[1]] <- first_infected
i <- 1
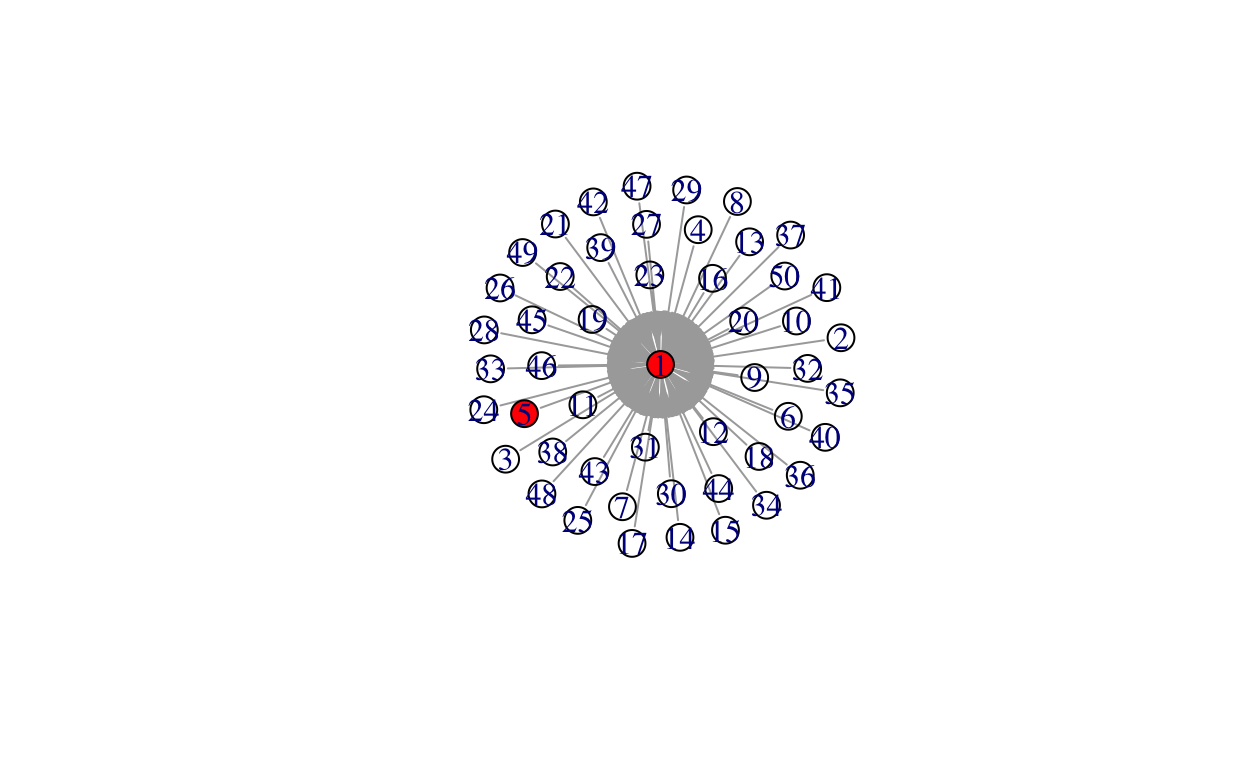
Find the neighbors of those who are infected.
# find neighbors of those who are infected
neighbor <- unlist(neighborhood(gstar, 1, unlist(infected)))
# remove from this list people who are already infected
neighbor <- neighbor[!neighbor %in% c(unlist(infected))]
neighbor
[1] 1For each neighbor, flip a coin to see if he or she becomes infected. Doing so will give me a series of 1s and 0s. 1 means infected. 0 means fine.
Combine these 1s and 0s with the neighbor identifiers.
allneighbors <- data.frame(
    "infected" = c(infects),
    "neighbor" = c(neighbor)
  )

allneighbors
  infected neighbor
1        1        1
Filter to only those who are infected. Save their identifiers.
Place these newly infected individuals into my store list.
infected[[i + 1]] <- infectedneighbors
Let’s do one more iteration.
i <- i + 1
Find neighbors of all those currently infected.
# find neighbors of those who are infected
neighbor <- unlist(neighborhood(gstar, 1, unlist(infected)))
# remove from this list people who are already infected
neighbor <- neighbor[!neighbor %in% c(unlist(infected))]
neighbor
[1] 2 3 4 5 6 7 8 9 10 11 12 13 14 15 16 17 18 19 20 21 22 23
[23] 25 26 27 28 29 30 31 32 33 34 35 36 37 38 39 40 41 42 43 44 45 46
[45] 47 48 49 50For each neighbor, flip a coin to see if he or she becomes infected. Doing so will give me a series of 1s and 0s. 1 means infected. 0 means fine.
Combine these 1s and 0s with the neighbor identifiers.
allneighbors <- data.frame(
"infected" = c(infects),
"neighbor" = c(neighbor)
)
allneighbors
infected neighbor
1 1 2
2 1 3
3 1 4
4 1 5
5 0 6
6 0 7
7 0 8
8 1 9
9 1 10
10 0 11
11 1 12
12 1 13
13 1 14
14 1 15
15 1 16
16 1 17
17 1 18
18 1 19
19 0 20
20 1 21
21 1 22
22 0 23
23 1 25
24 1 26
25 1 27
26 0 28
27 0 29
28 1 30
29 0 31
30 0 32
31 1 33
32 1 34
33 0 35
34 1 36
35 1 37
36 1 38
37 1 39
38 1 40
39 1 41
40 1 42
41 1 43
42 1 44
43 1 45
44 1 46
45 1 47
46 0 48
47 1 49
48 0 50Filter to only those who are infected. Save their identifiers.
Place these newly infected individuals into my store list.
infected[[i + 1]] <- infectedneighbors
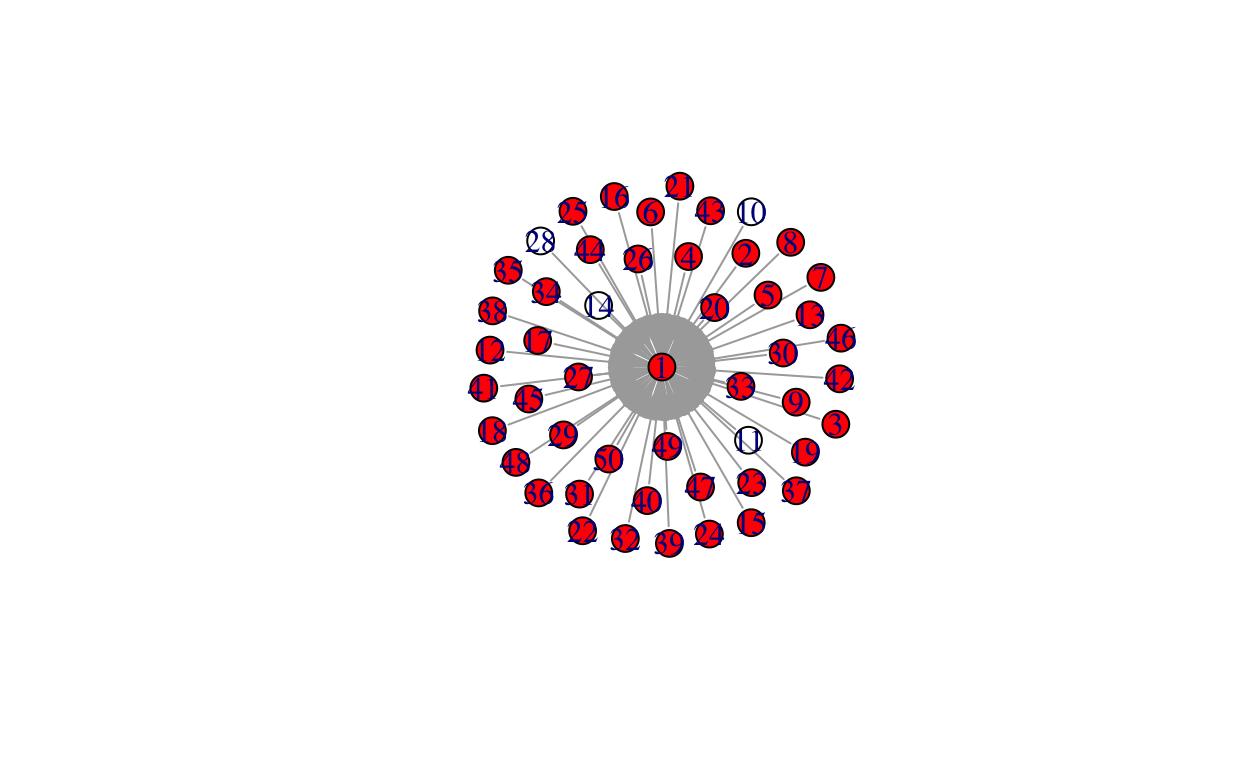
Plot the infected individuals.

Full Model
I’ll plot the network at each iteration so we can see it update.
library(igraph)
library(animation)
library(tidyverse)
# infection probability
prob <- 0.8
# create network
net_size <- 50
gstar <- graph.star(net_size)
plot(gstar)
# seed it, meaning place an infected individual (or individuals) into it
number_initially_infected <- 1
first_infected <- sample(V(gstar), number_initially_infected)
first_infected <- as_ids(first_infected)
infected <- list()
infected[[1]] <- first_infected
# iterate network dynamics
i <- 1
total_infected <- unlist(infected)
V(gstar)$color[V(gstar)%in%total_infected] <- "red"
plot(gstar)
while(length(total_infected) < net_size){
neighbor <- unlist(neighborhood(gstar, 1, unlist(infected)))
neighbor <- neighbor[!neighbor %in% c(unlist(infected))]
infects <- rbinom(length(neighbor), 1, prob = prob)
allneighbors <- data.frame(
"infected" = c(infects),
"neighbor" = c(neighbor)
)
infectedneighbors <- allneighbors %>%
    filter(infected == 1) %>%
    pull(neighbor)
infected[[i + 1]] <- infectedneighbors
total_infected <- unlist(infected)
i <- i + 1
V(gstar)$color[V(gstar)%in%total_infected] <- "red"
plot(gstar)
}


Bo\(^2\)m =)