Inspired by Bill Burr’s Monday Morning Podcast, episode 6-6-19.
He describes how people that do not understand hockey wanted to get fighting out of the NHL, so in the 2000’s they made greater efforts to remove goons (fighters). What people outside the NHL often do not understand, though, is that fighting is used to minimize dirty play. When a team is playing dirty, you – as a couch of the team that is not playing dirty – send out a goon to punch around a few of their players. In doing so, the other team knocks it off and play continues candidly. Fighting looks bad, but the overall amount of dirty play in the NHL is reduced when it contains a sufficient population of goons. Sounds like systems thinking.
Simulation Set-Up
States and Relationships
2 states modeled over time (number of goons and number of dirty plays, or the level of “dirtiness” in the NHL)
Number of goons fluctuates independently but with autoregression
- N_goons(t) = N_goons(t-1)
Dirtiness level is a function of its prior self and the number of goons, such that a greater number of goons causes lower levels of dirtiness
- D_level(t) = D_level(t-1) - N_goons(t)
Flow
First, watch the states fluctuate over time and establish equilibrium
Second, remove a bunch of goons and then see what happens to the system
Simulation
Initial levels of goons and dirtiness.
n_goons_initial <- 30
d_level_initial <- 15
Now simulate the states across time (20 time points) according to the simulation set-up above. Alpha will be set to 0.7 for both states and beta will be set to 0.2. The forcing terms for goons and dirtiness will be, respectively, 25 and 20.
time <- 30
df_mat <- matrix(ncol = 3, nrow = time)
count <- 0

for(i in seq_along(1:time)){
  count <- count + 1


  if(i == 1){

    df_mat[count, 1] <- n_goons_initial
    df_mat[count, 2] <- d_level_initial
    df_mat[count, 3] <- i

  }else{


    df_mat[count, 1] <- 25 + 0.7*df_mat[count - 1, 1] + rnorm(1, 0, 1)
    df_mat[count, 2] <- 20 + 0.7*df_mat[count - 1, 2] - 0.2*df_mat[count, 1] + rnorm(1, 0, 1)
    df_mat[count, 3] <- i


  }


}

df <- data.frame(df_mat)
names(df) <- c('n_goons', 'd_level', 'time')
View both states over time.
library(ggthemes)
df_plot <- df %>%
  gather(n_goons, d_level, key = 'variable', value = 'value')

ggplot(df_plot, aes(x = time, y = value, color = variable)) +
  geom_point() +
  geom_line()

As you can see, the number of goons and the dirtiness level in the NHL drive toward equilibrium levels over time. There are goons, which means there are fights and the potential to appear “dirty” to anyone without an understanding of the system, but having goons around maintains the overall dirtiness within the NHL at low levels.
Now, what happens to the level of dirtiness when we remove a bunch of goons at time point 14 and beyond?
n_goons_initial <- 30
d_level_initial <- 15

time <- 30
df_mat <- matrix(ncol = 3, nrow = time)
count <- 0

for(i in seq_along(1:time)){
  count <- count + 1


  if(i == 1){

    df_mat[count, 1] <- n_goons_initial
    df_mat[count, 2] <- d_level_initial
    df_mat[count, 3] <- i

  }else if (i <=13){

    df_mat[count, 1] <- 25 + 0.7*df_mat[count - 1, 1] + rnorm(1, 0, 1)
    df_mat[count, 2] <- 20 + 0.7*df_mat[count - 1, 2] - 0.2*df_mat[count, 1] + rnorm(1, 0, 1)
    df_mat[count, 3] <- i


    # HERE IS THE CHANGE
  }else if(i  > 13){

    num_goons <- sample(c(2,3,4), 1)
    df_mat[count, 1] <- num_goons
    df_mat[count, 2] <- 20 + 0.7*df_mat[count - 1, 2] - 0.2*df_mat[count, 1] + rnorm(1, 0, 1)
    df_mat[count, 3] <- i
    ######################################

  }
}


df <- data.frame(df_mat)
names(df) <- c('n_goons', 'd_level', 'time')

df_plot <- df %>%
  gather(n_goons, d_level, key = 'variable', value = 'value')

ggplot(df_plot, aes(x = time, y = value, color = variable)) +
  geom_point() +
  geom_line()
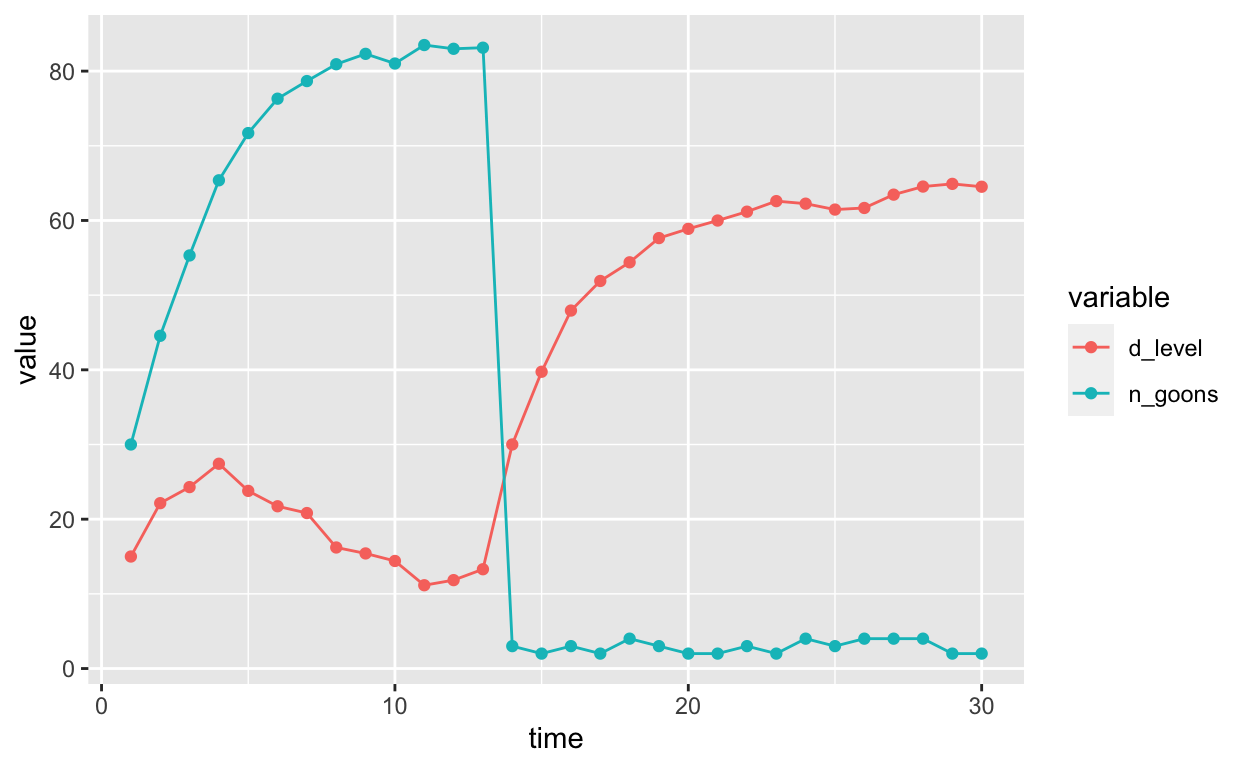
What happened? The level of dirtiness increases after removing goons. In other words, removing goons, or fighters, from the NHL may make the game appear more civil from the outside, but goons are embedded in a system that maintains overall low levels of dirtiness. When the goons are removed – and they are a crucial part of the system – dirtiness levels increase dramatically.
Bo\(^2\)m =)