A few random notes about plotting, describing, and thinking about trajectories.
Plotting Trajectories
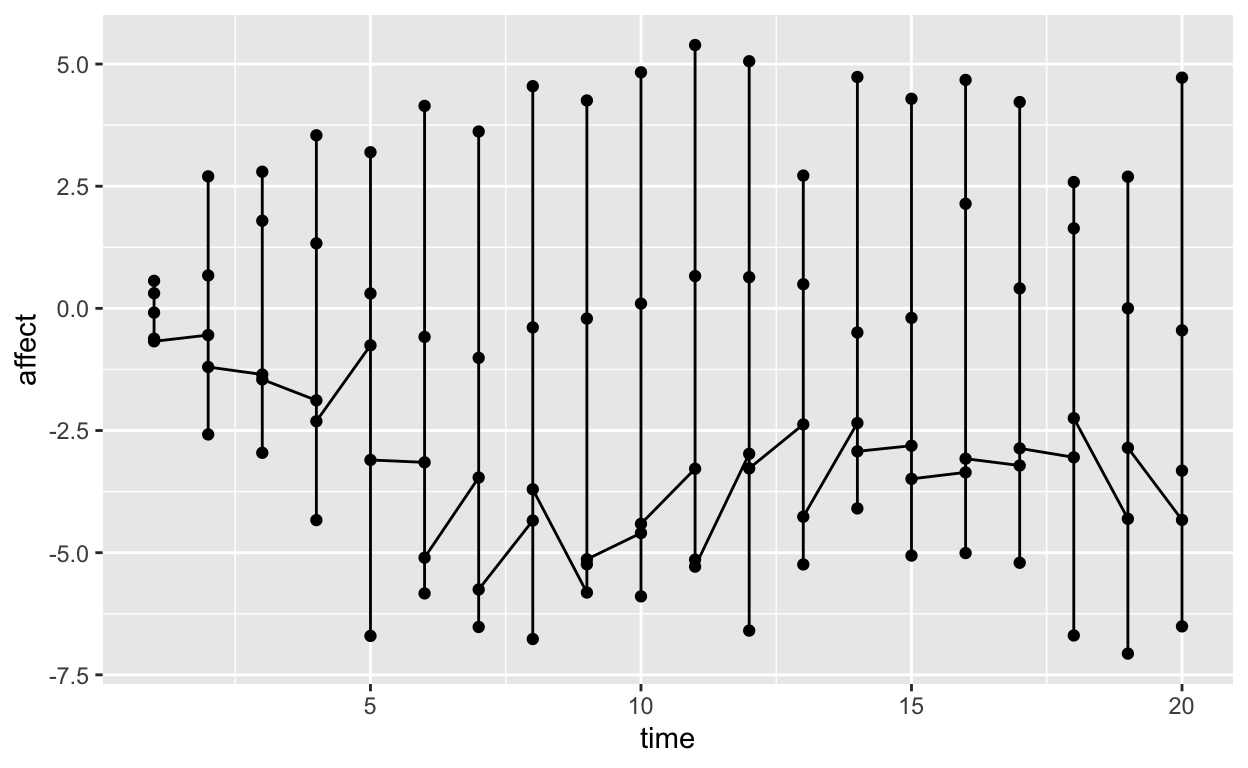
Imagine we record “affect” (\(Y\)) for five people over 20 time points. ggplot2 produces poor longitudinal trajectories if you only specify time and affect as variables:
library(ggplot2)
library(tidyverse)

plot1 <- ggplot(df1, aes(x = time, y = affect)) +
  geom_point() +
  geom_line()

plot1
Instead, specify “id” either as the grouping variable:
plot2 <- ggplot(df1, aes(x = time, y = affect, group = id)) +
  geom_point() +
  geom_line()

plot2
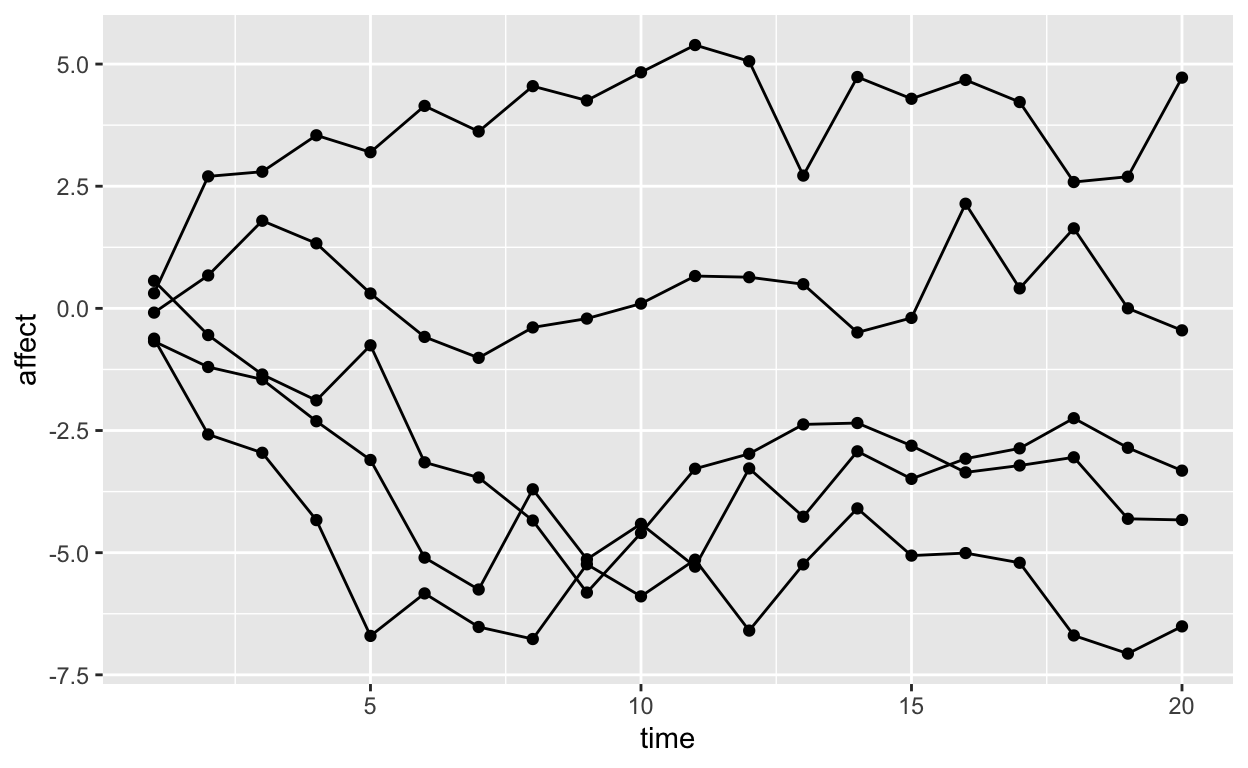
or a color.
plot3 <- ggplot(df1, aes(x = time, y = affect, color = id)) +
  geom_point() +
  geom_line()

plot3

If you have a data set with too many trajectories
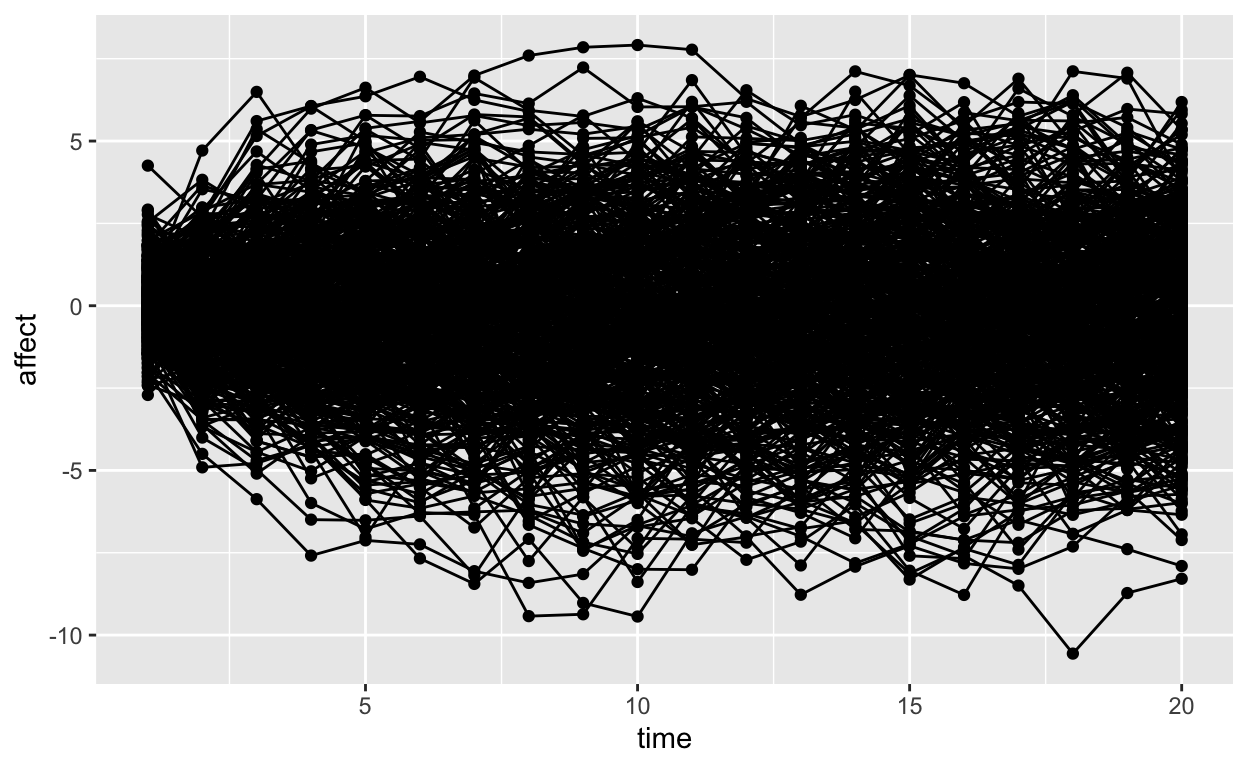
then select a random sample to keep dark
and change the color of the background trajectories to a lighter color.
plot5 <- ggplot(df2, aes(x = time, y = affect, group = id)) +
  geom_point(color = 'gray85') +
  geom_line(color = 'gray85') +


  # HERE COMES ADDITIONAL CHANGES

  geom_point(data = df2_sample, aes(x = time, y = affect, group = id)) +
  geom_line(data = df2_sample, aes(x = time, y = affect, group = id))

plot5
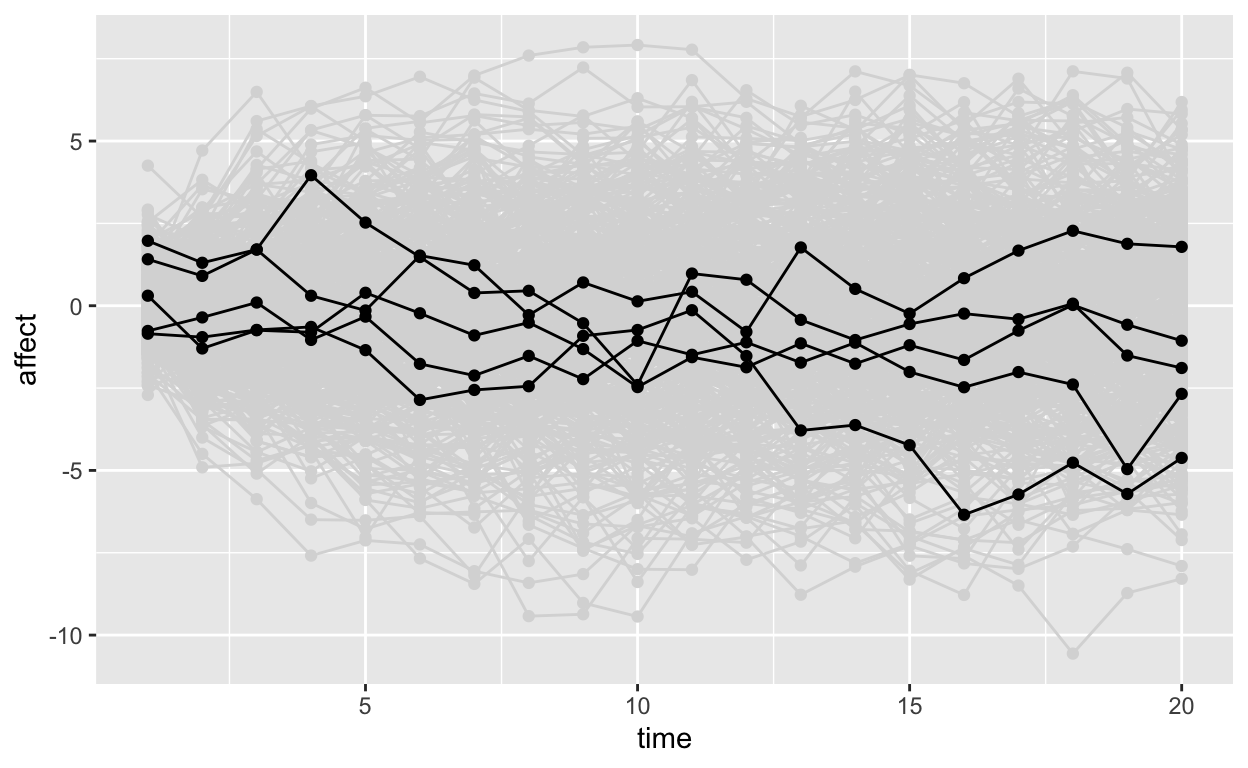
Notice that I had to evoke two additional geom commands and source my new data sample.
Trajectory Descriptions
Equilibrium

Panel A: Increasing equilibrium level with constant variance.
Panel B: Decreasing equilibrium level with constant variance.
Panel C: Decreasing equilibrium level with increasing variance.
Latent Growth Intercepts and Slopes
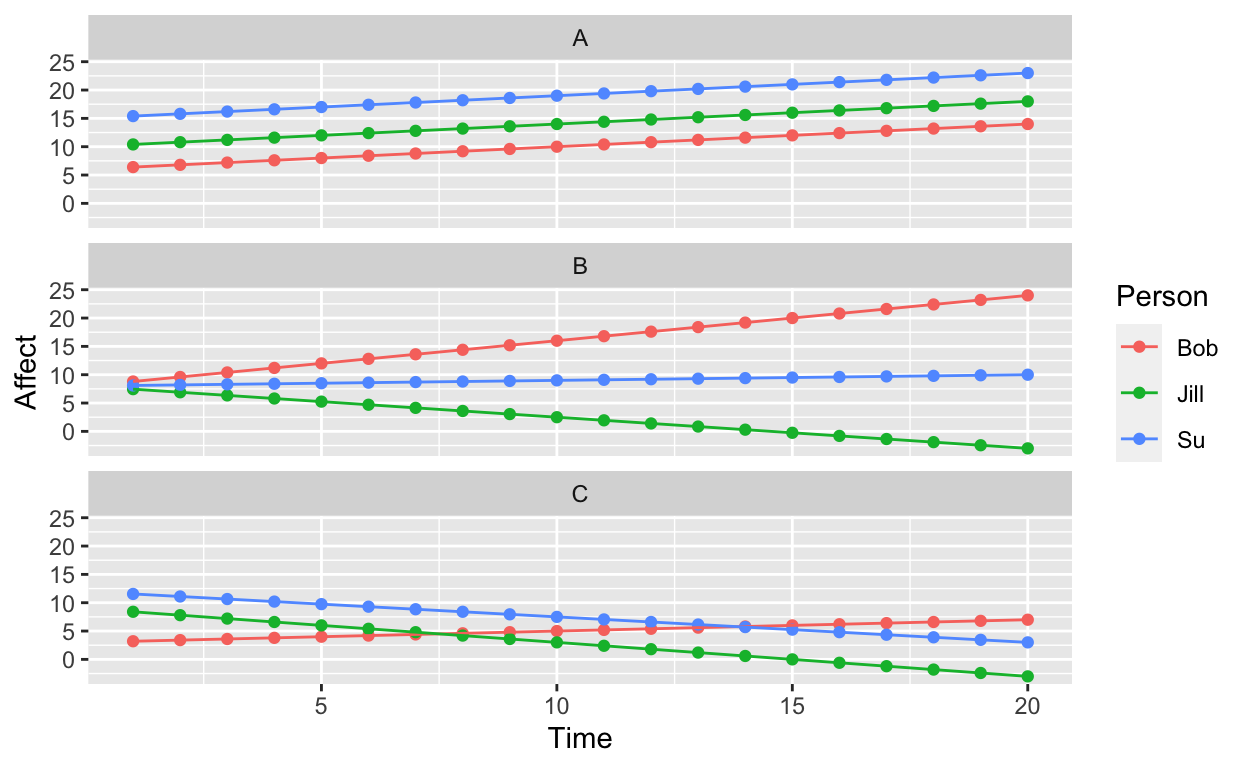
Panel A: Between person differences in intercept but no differences in slope.
Panel B: Between person differences in slope but no differences in intercept.
Panel C: Between person differences in intercepts and slopes.
Between and Within Person Variance
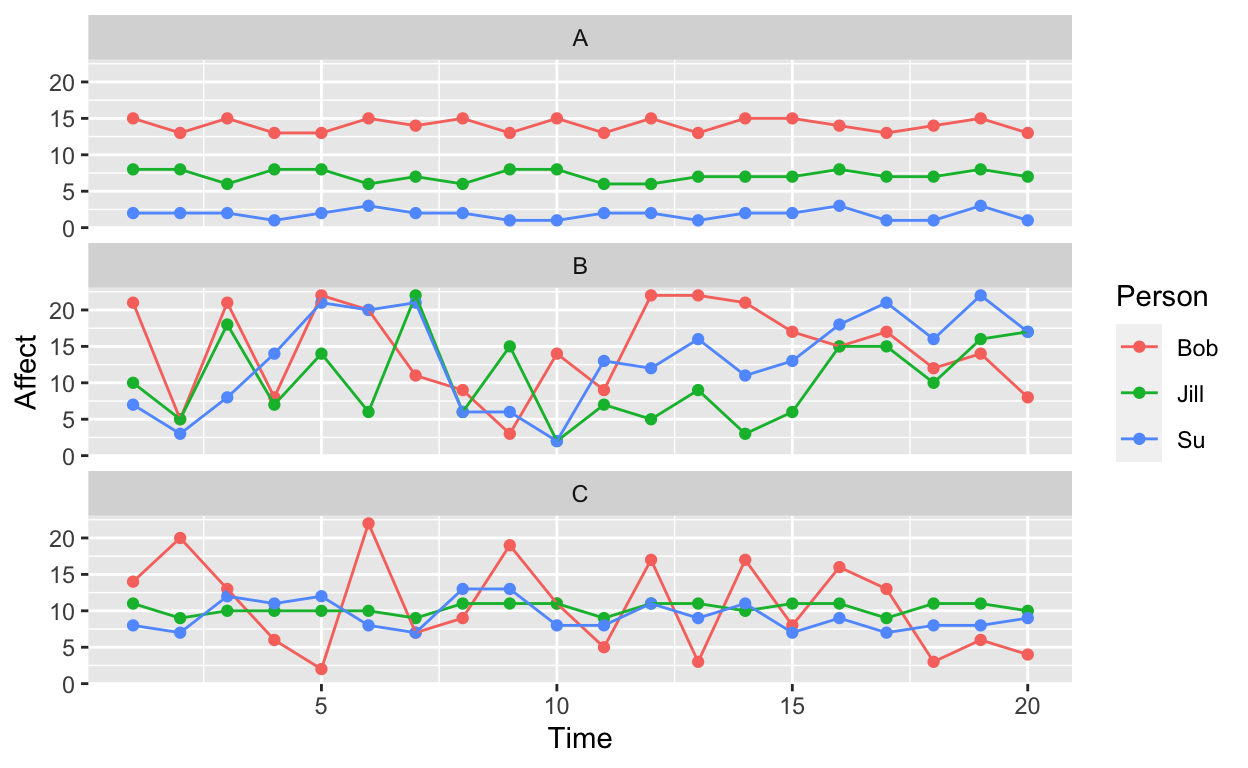
Panel A: Between person differences in level (intercept in LGC literature) but no between person differences in variability.
Panel B: No between person differences in level (intercept) or variability, but the amount of variability in these trajectories is greater than Panel A. Panel C: No between person differences in level (intercept) but there are between person differences in variability.
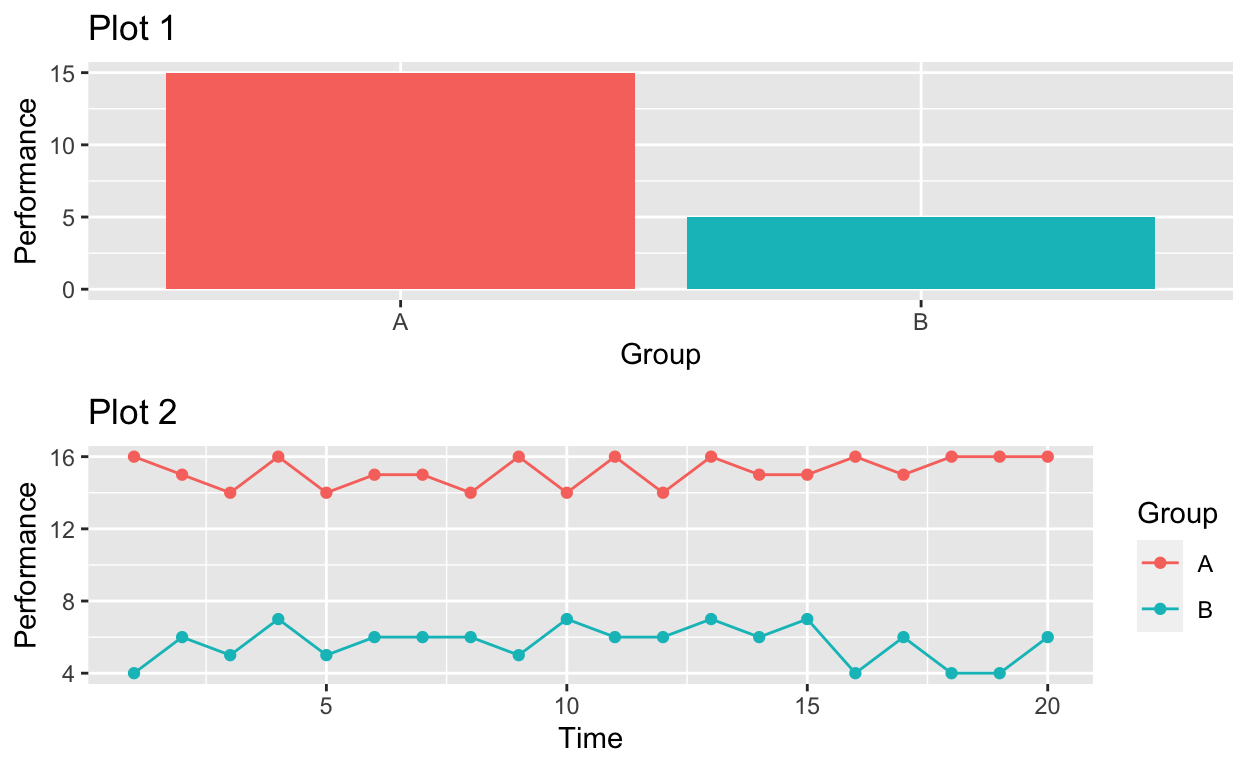
Main Effects and Interactions (Cross Sectional vs. Over Time)
Imagine we re-test the main and interaction effects from a cross-sectional study several times. If the results are stable across time, what would they look like?
Main Effect
Group A (difficult, specific goals) higher performance than group B (vague goals).
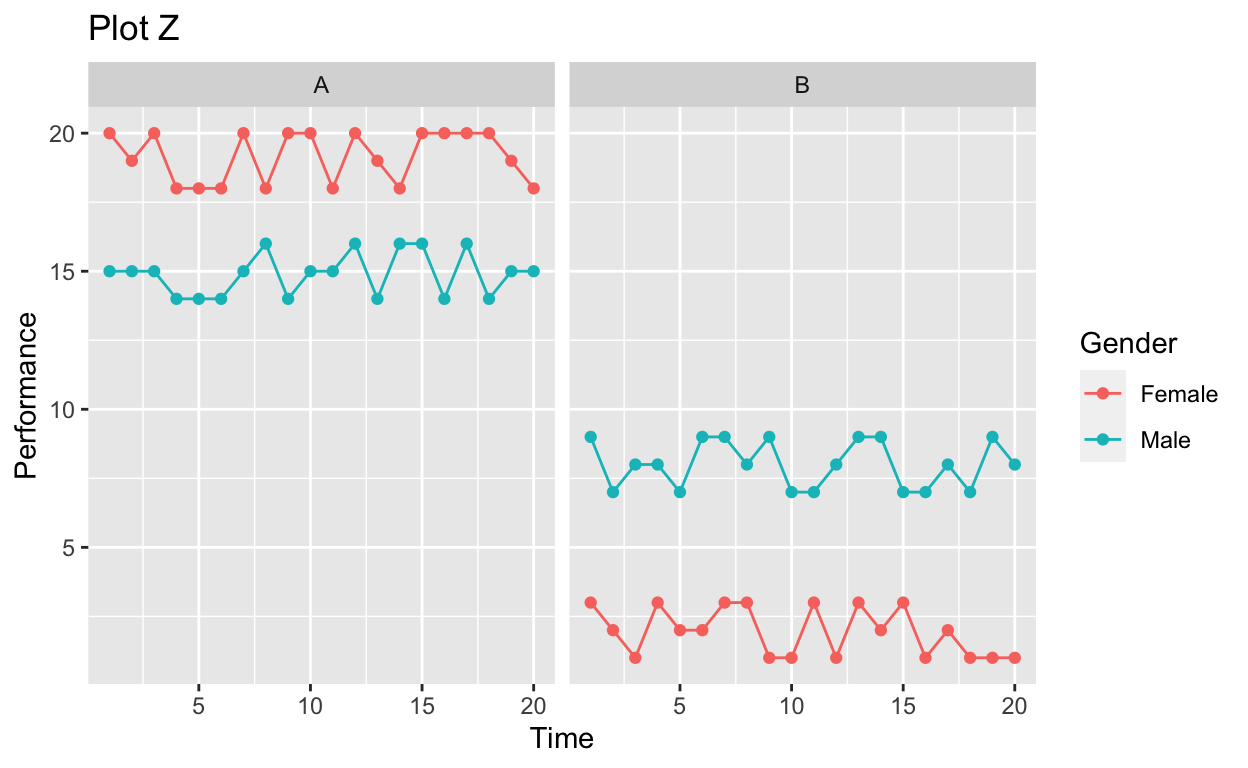
Interaction
For males: Group A (difficult, specific goals) higher performance than group B (vague goals). For females: Group B (vague goals) higher performance than group B (difficult, specific goals).

Interaction and Main Effect
Bo\(^2\)m =)